
Monitoring IBM Websphere Datapower using Nagios
Using Nagios XI components we can monitor IBM Websphere Datapower appliance. Tough we have Datapower related statistics information but customer do ask us about monitoring DP appliance which shows Graphs, Usage in clear picture etc and also they want to check the traps.
Nagios XI is one of the perfect tool which has all those capabilities to check the SNMP related events. Though there are other tools, but we used Nagios Xi here for Datapower.
Once nagios is installed and configured (through ESX or VM or Standalone Installation),
Open the Nagios XI console and follow these steps
Step 1:Upload Datapower MIBs
Click on Admin in the menu
Click on Manage MIBs
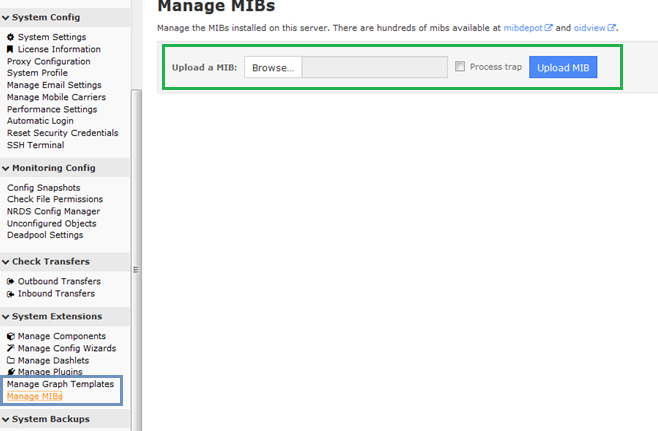
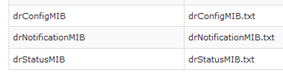
Browse and upload the 3 MIBs as part of Datapower SNMP process (Check our Blog link here)
Select SNMP Traps if required to monitor the traps and click on Upload MIB. Below screen shows the uploaded files.
Step 2: Create SNMP Agent in Nagios
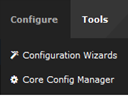
Click on Configure and click on Configuration Wizards
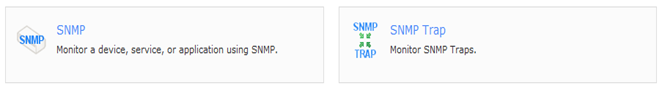
Click on SNMP
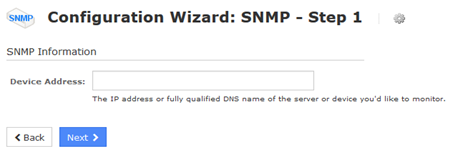
Provide Datapower IP and click on Next
In SNMP Settings, make sure that we give the right Community name as configured in Datapower. Any authentication or any other use of SNMP v3 protocol, make sure that SNMP Authentication is populated.

In SNMP Services, make sure that proper OIDs are gathered for monitoring Datapower. List of how to get OIDs is mentioned in our earlier blog entry.
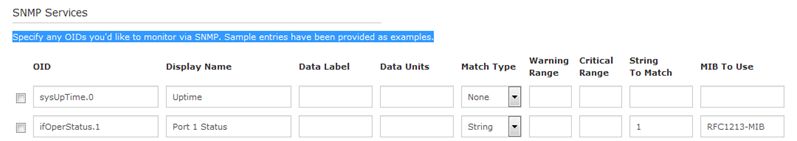
Click on Next and then Finish.
If all the entries provided in SNMP Services with proper OIDs are given, then you will see the entries being monitored in the Services window of Nagios.